

Sagemaker metrics
When you train models on Sagemaker, all the logs that your program emits are stored on AWS CloudWatch – a cloud logging service. Sagemaker allows us to define regular expressions to extract numeric metrics from these logs and visualise them.
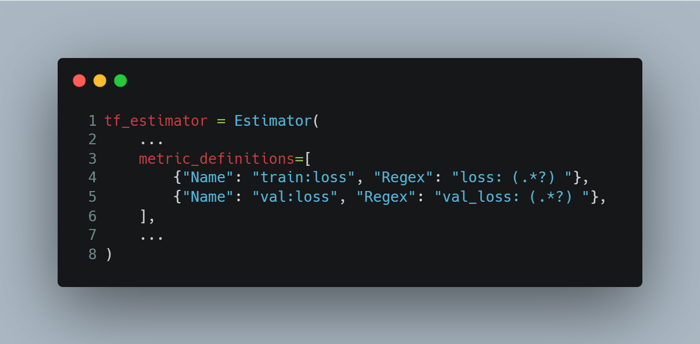
The metrics are defined via the metric_definitions argument to the Estimator object. Here is how we can define the loss metric for Tensorflow models:
When you run the job with the new metric definitions, you will see both the concise metric graphs and the link View algorithm metrics on the job details page. The link navigates to the CloudWatch metrics page where you can see metric numbers in detail. The link always displays the graph for the last 3h. So if you’re opening a job that completed last day or week, you need to manually navigate to the right time period:

Sagemaker Debugger
Sagemaker Debugger allows to save the internal training state at periodic intervals, which you can analyse in two ways:
- Interactively by viewing the data in Jupyter notebooks
- In real-time by using debugger rules
To enable the Sagemaker debugger, we need to amend run_sagemaker.py and train.py files.
run_sagemaker.py
-1.png?width=700&height=517&name=carbon%20(1)-1.png)
As a minimal configuration, we need to provide the location on S3 where the debug data will be stored, and list the collections to store. And then pass the hook config to the Estimator object.
The full list of built-in collections is available here:
https://github.com/awslabs/sagemaker-debugger/blob/master/docs/api.md#built-in-collections
More about available configuration options:
https://github.com/awslabs/sagemaker-debugger/blob/master/docs/sagemaker.md#enabling-sagemaker-debugger
train.py
import smdebug.tensorflow as smd
-1.png?width=700&height=479&name=carbon%20(2)-1.png)
Remember that we are using a custom docker image to run training jobs. In this case, Sagemaker creates a JSON config for the debugger and uploads it on our image. We can then use create_from_json_file function to load this config and pass it as a callback to our Tensorflow model’s fit method. Use KerasHook if your model uses Keras API with Tensorflow 2.x.
More about different hook classes here: https://github.com/awslabs/sagemaker-debugger/blob/master/docs/api.md
Interactive data analysis via Jupyter Notebooks
I haven't worked with this functionality myself, but there are some relevant notebooks from AWS:
- https://github.com/awslabs/amazon-sagemaker-examples/blob/master/sagemaker-debugger/mnist_tensor_analysis/mnist_tensor_analysis.ipynb
- https://github.com/awslabs/amazon-sagemaker-examples/blob/master/sagemaker-debugger/mxnet_realtime_analysis/mxnet-realtime-analysis.ipynb
Real-time analysis via debugger rules
Sagemaker also has a concept of debugger rules. They basically analyse the debugger output in realtime during the job execution, and watch for some common problems in training, like model overfitting, vanishing gradients, class imbalance, etc. I haven't experimented much with them.
The rules are also different depending on the model used. Here is the full list: https://docs.aws.amazon.com/sagemaker/latest/dg/debugger-built-in-rules.html
More about the relationship between the debugger hook and rules here: https://sagemaker.readthedocs.io/en/stable/amazon_sagemaker_debugger.html#relationship-between-debugger-hook-and-rules
Tensorboard with Sagemaker
Tensorboard is a tool to visualise and understand your Tensorflow models. To store Tensorboard output with Sagemaker, we need to add a couple more lines to our run_sagemaker.py:
-1.png?width=700&height=460&name=carbon%20(3)-1.png)
First, we configure the paths to store Tensorboard data on S3 and locally within our Docker container (no need to change). Second, we pass a tensorboard_output_config argument to the Estimator constructor.
⚠️ A debugger hook is required for Tensorboard on Sagemaker. It specifies the collections to store as we described above. If you specify only the Tensorboard config, Sagemaker will not throw any errors or warnings, but won't output anything on S3. So when you run your first job with such a config, check that the specified S3 directory is getting filled with data.
To run the Tensorboard on your machine:
aws configureif haven't done already.export AWS_REGION=XXXexport AWS_LOG_LEVEL=3(otherwise s3 lib gets too talkative)pip install tensorboardtensorboard --logdir "s3://BUCKET/sagemaker/REPO_NAME/tensorboard/JOB_NAME/tensorboard-output"
You can then access Tensorboard UI on http://localhost:6006.
Run Tensorboard on Sagemaker Notebooks
To run Tensorboard in a Jupyter notebook on Sagemaker:
-1.png?width=700&height=287&name=carbon%20(4)-1.png)
If the magic command (%) times out, start Tensorboard from the command line:
-1.png?width=700&height=249&name=carbon%20(5)-1.png)
And then connect from the browser using a special proxy port: https://NOTEBOOK_URL/proxy/6006/
More details here:
https://www.tensorflow.org/tensorboard/tensorboard_in_notebooks.
Putting it all together
All the files from this post can be found at:
https://github.com/fairtiq/sagemaker-templates/tree/master/sagemaker-docker-tensorboard.


Share